
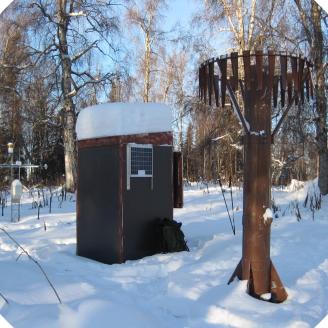
The NRCS Snow Survey Program provides mountain snowpack data and streamflow forecasts for the western United States and Alaska. Data is collected through automated weather stations (SNOTEL and SNOLITE), manual snow measurements (Snow Courses), and through partnering agencies and networks. Common applications of Snow Survey products include water supply management, flood control, climate modeling, recreation, and conservation planning.
The Alaska Snow Survey operates over 80 automated weather stations that report data hourly through satellite transmission. Through the help of partners and cooperators, close to 200 manual snow measurement sites are measured during the winter. Four Snow Survey Reports detailing the state of the snowpack across Alaska are published in February, March, April, and May.
Snow Survey Products
Current Data Maps
Snow Water Equivalent (SWE)
Basin-filled Daily SWE - Percent of Normal
Basin-filled Monthly SWE - Percent of Normal
Monthly SWE - Percent of Normal
Snow Depth
Daily Snow Depth - Value in inches
Daily Snow Depth - 7-day Delta
Monthly Snow Depth - Value in inches
Precipitation
Basin-filled Precipitation - Percent of Normal (since Oct 1)
Precipitation - Percent of Normal (since Oct 1)
Current Hourly Data
Click on a station to see hourly data from the past 3 days
- Alexander Lake
- American Creek
- Anchor River Divide
- Anchorage Hillside
- Aniak
- Atigun Pass
- Bettles Field
- Checkers Creek
- Chena Lakes
- Chisana
- Coldfoot
- Cooper Lake
- Creamers Field
- Dahl Creek
- Eagle Summit
- East Palmer
- Esther Island
- Exit Glacier
- Fielding Lake
- Flower Mountain
- Fort Yukon
- Frostbite Bottom
- Galena AK
- Gobblers Knob
- Grandview
- Granite Crk
- Grouse Creek Divide
- Gulkana River
- Heen Latinee
- Hoonah
- Horsepasture Pass
- Hozatka Lake
- Imnaviat Creek
- Independence Mine
- Indian Pass
- Jack Wade Jct
- Johnsons Camp
- Kantishna
- Kanuti Lake
- Kelly Station
- Kenai Moose Pens
- Little Chena Ridge
- Long Lake
- Look Eyrie
- Lower Kachemak Creek
- May Creek
- McGrath
- Mcneil Canyon
- Mcneil River SGS
- Middle Fork Bradley
- Monahan Flat
- Monument Creek
- Moore Creek Bridge
- Moraine
- Mount Ripinsky
- Mt. Alyeska
- Mt. Eyak
- Mt. Ryan
- Munson Ridge
- Nenana
- Nicks Valley
- Nuchek
- Nuka Glacier
- Paradise Hill
- Pargon Creek
- Port Graham
- Port San Juan
- Prudhoe Bay
- Rocky Point
- Sagwon
- Schor Garden
- Seal Island
- Spring Creek
- Strawberry Reef
- Sugarloaf Mtn
- Summit Creek
- Susitna Valley High
- Tatitlek
- Telaquana Lake
- Teuchet Creek
- Tok
- Tokositna Valley
- Turnagain Pass
- Upper Chena
- Upper Nome Creek
- Upper Tsaina River
Current Daily Data
Click on a station to see daily data for the current water year (begins Oct 1)
- Alexander Lake
- American Creek
- Anchor River Divide
- Anchorage Hillside
- Aniak
- Atigun Pass
- Bettles Field
- Checkers Creek
- Chena Lakes
- Chisana
- Coldfoot
- Cooper Lake
- Creamers Field
- Dahl Creek
- Eagle Summit
- East Palmer
- Esther Island
- Exit Glacier
- Fielding Lake
- Flower Mountain
- Fort Yukon
- Frostbite Bottom
- Galena AK
- Gobblers Knob
- Grandview
- Granite Crk
- Grouse Creek Divide
- Gulkana River
- Heen Latinee
- Hoonah
- Horsepasture Pass
- Hozatka Lake
- Imnaviat Creek
- Independence Mine
- Indian Pass
- Jack Wade Jct
- Johnsons Camp
- Kantishna
- Kanuti Lake
- Kelly Station
- Kenai Moose Pens
- Little Chena Ridge
- Long Lake
- Look Eyrie
- Lower Kachemak Creek
- May Creek
- McGrath
- Mcneil Canyon
- Mcneil River SGS
- Middle Fork Bradley
- Monahan Flat
- Monument Creek
- Moore Creek Bridge
- Moraine
- Mount Ripinsky
- Mt. Alyeska
- Mt. Eyak
- Mt. Ryan
- Munson Ridge
- Nenana
- Nicks Valley
- Nuchek
- Nuka Glacier
- Paradise Hill
- Pargon Creek
- Port Graham
- Port San Juan
- Prudhoe Bay
- Rocky Point
- Sagwon
- Schor Garden
- Seal Island
- Spring Creek
- Strawberry Reef
- Sugarloaf Mtn
- Summit Creek
- Susitna Valley High
- Tatitlek
- Telaquana Lake
- Teuchet Creek
- Tok
- Tokositna Valley
- Turnagain Pass
- Upper Chena
- Upper Nome Creek
- Upper Tsaina River
Current Hourly Soils Data
Click on a station to see hourly soil moisture (SMS) or soil temperature (STO) data for the current calendar year
- American Creek > SMS | STO
- Anchor River Divide > SMS | STO
- Aniak > SMS | STO
- Atigun Pass > SMS | STO
- Checkers Creek > SMS | STO
- Chisana > SMS | STO
- Coldfoot > SMS | STO
- Eagle Summit > SMS | STO
- Exit Glacier > SMS | STO
- Fielding Lake > SMS | STO
- Galena AK > SMS | STO
- Gobblers Knob > SMS | STO
- Granite Crk > SMS | STO
- Gulkana River > SMS | STO
- Hoonah > SMS | STO
- Imnaviat Creek > SMS | STO
- Jack Wade Jct > SMS | STO
- Kanuti Lake > SMS | STO
- Kelly Station > SMS | STO
- Kenai Moose Pens > SMS | STO
- Little Chena Ridge > SMS | STO
- May Creek > SMS | STO
- McGrath > SMS | STO
- Mcneil River SGS > SMS | STO
- Monahan Flat > SMS | STO
- Monument Creek > SMS | STO
- Moore Creek Bridge > SMS | STO
- Mt. Ryan > SMS | STO
- Munson Ridge > SMS | STO
- Nenana > SMS | STO
- Nuka Glacier > SMS | STO
- Port Graham > SMS | STO
- Prudhoe Bay > SMS | STO
- Rocky Point > SMS | STO
- Schor Garden > SMS | STO
- Spring Creek > SMS | STO
- Summit Creek > SMS | STO
- Susitna Valley High > SMS | STO
- Telaquana Lake > SMS | STO
- Tok > SMS | STO
- Tokositna Valley > SMS | STO
- Upper Nome Creek > SMS | STO
- Upper Tsaina River > SMS | STO
Monthly Snow Survey Reports
See recent monthly snow survey reports
Issued February, March, April, and May detailing state of the Alaska snowpack
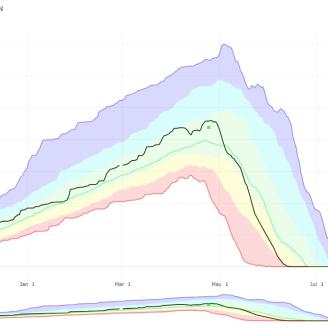
Air, Water, and Soil Plots
Air, Water, and Soil (AWS) plots show current data in the context of historic data
Water Supply Forecasts
A water supply forecast is a prediction of streamflow volume that will flow past a point on a stream during a specified season, typically in the spring and summer. The Natural Resources Conservation Service (NRCS) issues water supply forecasts for hundreds of points in the western United States near the first of the month between January and June each year and at other times as requested.
Site Metadata
Table of Metadata for all Alaska SNOTEL, SNOLITE, SCAN, and Other Hydrometeorological Sites
Table of Metadata for all Alaska Snow Courses
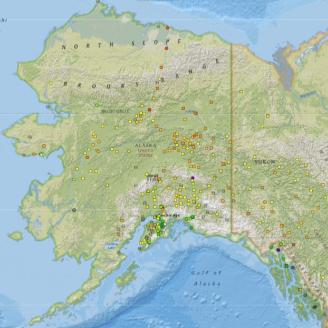
Interactive Map of SNOTEL, SNOLITE, Snow Courses, and Other Hydrometeorological Sites
Explore map of all sites within the National Water and Climate Center network. Click on individual sites > Data Reports > Site Page to access more metadata.
National Snow Survey and Water Supply Forecasting Resources
Snow and Water Interactive Map
Welcome to the National Water and Climate Center's Snow and Water Interactive Map, a groundbreaking tool designed to provide farmers, researchers, policymakers, and water management professionals with up-to-the-minute snow survey data and water supply forecasting.
Snow and Climate Monitoring Predefined Reports and Maps
The National Water and Climate Center provides a number of predefined reports, using the online tools it administers for the Snow Survey and Water Supply Forecasting Program.
National Water and Climate Center
The National Water and Climate Center (NWCC) administers the Snow Survey and Water Supply Forecasting Program (SSWSF) and the Soil Climate Analysis Network, and manages the Water and Climate Information System.
The History of Snow Survey and Water Supply Forecasting
The seven oral history interviews and three articles in this volume recount significant historical developments in snow surveying and waters supply forecasting in the Western U.S. since 1935.
Other Regional Snow Surveys
- Yukon - Snow Survey and Water Supply Forecast
- British Columbia - Snow Survey Data | River Forecast Centre
- Lower 48 - Snow Survey and Water Supply Forecasts
Climate and Weather Resources
- Alaska-Pacific River Forecast Center
- US Geological Survey Water Data - Alaska
- National Weather Service Forecast Offices - Anchorage | Fairbanks | Juneau
- US Drought Monitor
- National Centers for Environmental Information
- National Operational Hydrologic Remote Sensing Center
Alaska Snow and Avalanche Resources
- Alaska Department of Transportation Winter Resources
- Alaska Dept of Geological and Geophysical Surveys - Climate and Cryosphere Hazards
- Chugach National Forest Avalanche Information Center - Chugach, Kenai Mtns
- Hatcher Pass Avalanche Center
- Coastal Alaska Avalanche Center - Juneau, Southeast
- Alaska Avalanche Information Center - Valdez, Cordova, Haines, Eastern Alaska Range
- Avalanche Canada - Yukon - Haines Pass, White Pass
Employee Directory
| Name | Position | Phone Number | |
|---|---|---|---|
|
Daniel Fisher
|
Data Collection Officer
|
||
|
Tony DeMarco
|
Hydrologist
|
||
|
Austin Hart
|
Hydrologist
|
||
|
Keegan Krantz
|
Hydrologic Technician
|