
Temperature and Precipitation Departure Probability Categories
Five categories of temperature and precipitation departures have been defined by the National Climatic Data Center (NCDC) and are in widespread use.
Probability Categories
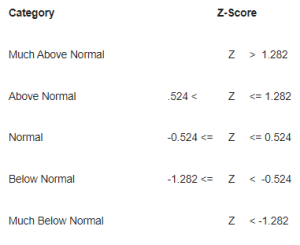
Five categories of temperature and precipitation departures have been defined by the National Climatic Data Center (NCDC) and are in widespread use. The table shows each category and the class limits for the Z-score (or standardized departure from average) categories.
Temperature Categories Used for Growing Season Calculations
Monthly and annual temperatures are usually well represented by the normal probability distribution; therefore, the Z-score was used to classify, by category, the growing season length. The growing season Z-score is calculated as z(i) = (T(i) - T(avg))/s, where T(i) is the growing season length associated with a given Z-score, z(i), T(avg) is the mean annual growing season length over the selected period (e.g., 1971-2000), and s is the standard deviation of the annual growing season lengths over the selected period (e.g., 1971-2000).
For example, Much Above Normal would represent any amount greater than a 1.282 standard departure above the mean. In a normal distribution, the Normal category will contain 40% of the values. The Above Normal and Below Normal categories will each contain 20% of the values, and the Much Above and the Much Below categories will each contain 10% of the values.
The 30% category shown in the WETS Table represents the class limit values associated with the NORMAL category Z-values of -0.524 and 0.524.
Precipitation Category Definitions
The same Z-score categories apply to precipitation, however, monthly and annual precipitation exceedance probabilities are calculated from fitting the observed monthly data to a two-parameter gamma probability distribution.
The two-parameter gamma distribution is asymmetrical and is used with continuous random variables such as precipitation. Its probability density function has a lower limit of 0 and an upper limit of infinity. The distribution was fit using the method outlined by the Soil Conservation Service (1985).