

Metrics document the value of the soil information to NRCS-SPSD customers who are making informed decisions, protecting the land, and enhancing agricultural productivity.
Prove It – Measuring Success of Our Soil Data and Information Services
Most of the world’s food and fiber production directly depends on soil as a growth medium, nutrient supply mediator, and buffer against daily changes in available moisture. While erosion can contribute to surface water contamination, most sources of drinking water benefit from filtration through the soil and underlying geologic strata. Soil scientists continuously update national soil survey products to provide the best available soil properties and interpretations to support relevant land management decisions.
The NRCS-Soil and Plant Science Division (SPSD) collects statistics on usage of Web Soil Survey, SoilWeb, Dynamic Soils Hub, and Soil Data Access to improve NRCS-SPSD support for conservation planning and implementation by designing new tools and services as well as improving performance. Analysis of these statistics (access date, time, and location), also referred to as “metrics,” clearly demonstrate the high value that customers place on the data.
How We Use Metrics:
- Ensure the accuracy and reliability of soil data.
- Standardize data formats, making it easier for users to access and interpret soil information.
- Facilitate interoperability with other systems, promoting seamless data exchange.
- Improve user-centric design to enhance accessibility and usability.
The metrics indicate that demand and user volume for technical soils information is growing. The soil science community identifies agricultural producers as a critical user base but also recognizes many other user groups who depend on soil survey information. It is critical to differentiate cohorts of customers, how and where soils information is consumed, and even the patterns of usage through time so NRCS-SPSD can effectively develop soil interpretation (models) at state, national, and global scales to meet users’ needs.
Digging In
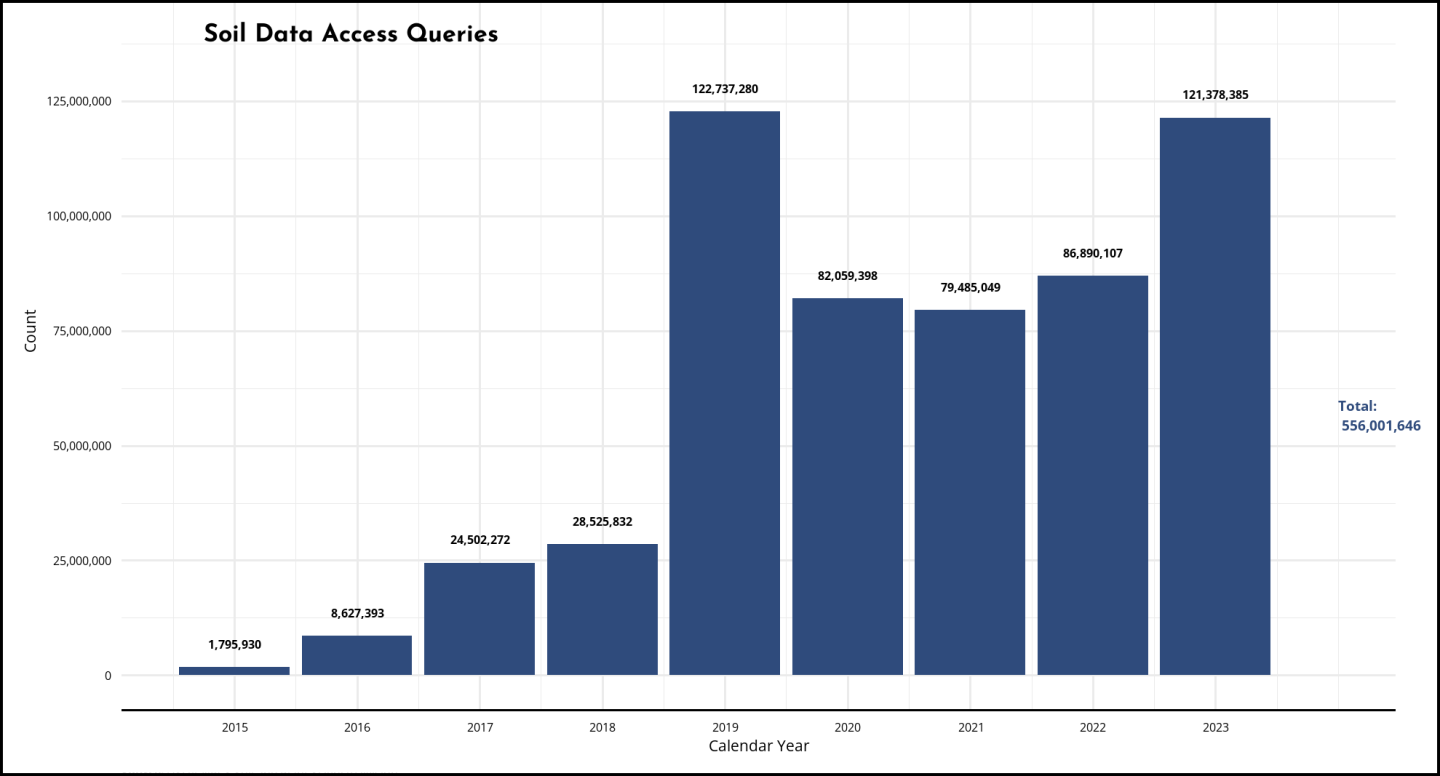
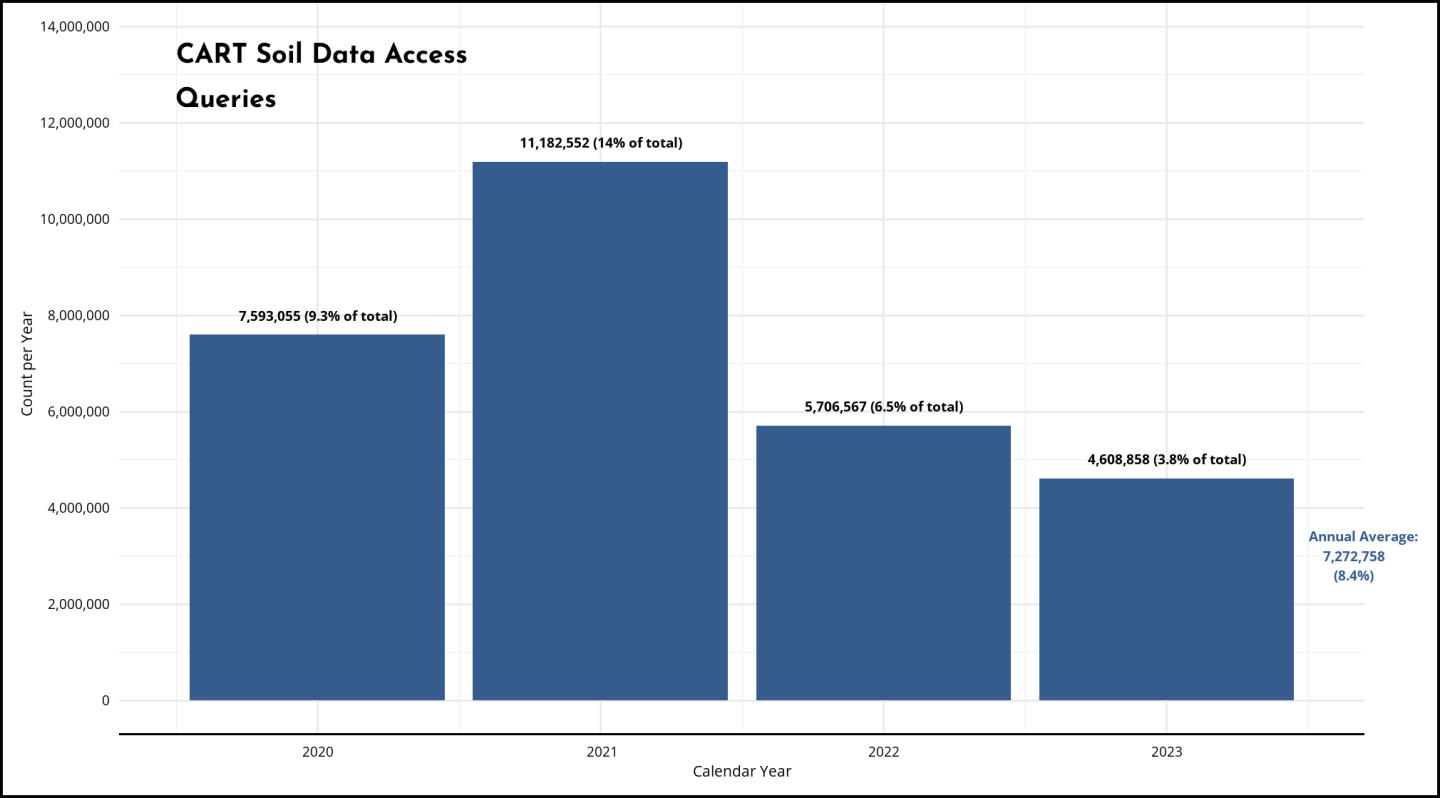
During fiscal year 2023, Web Soil Survey and Soil Data Access received 3,434,058 and 121,378,385 requests, respectively. In general, Soil Data Access traffic is greater than Web Soil Survey because the Soil Data Access application programming interface (API) is connected to many external applications and GIS tools. The standard SoilWeb application received 409,021 visits, Soil Data Explorer received 199,152 visits, and Series Extent Explorer received 55,240 visits. Roughly 50 percent of these visits were from mobile devices. The standard SoilWeb application received 4,000–5,000 unique requests for soils data per day, while the mobile interface had 500–800 unique requests per day. The Google Earth interface received 10,000–20,000 unique requests (each zoom or pan event is a request) per day.
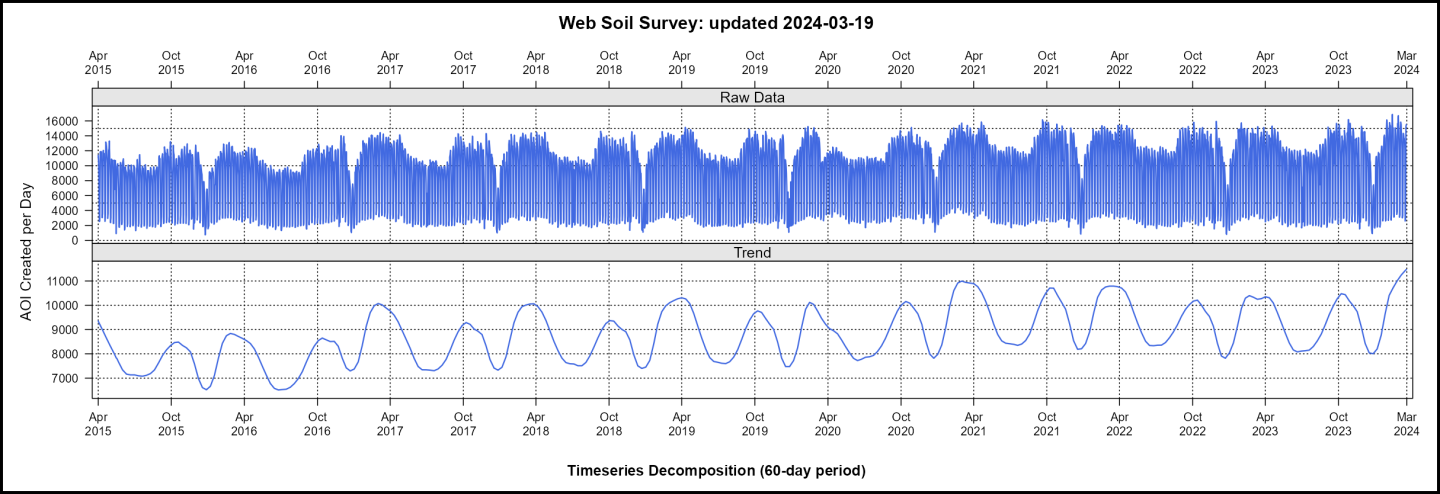
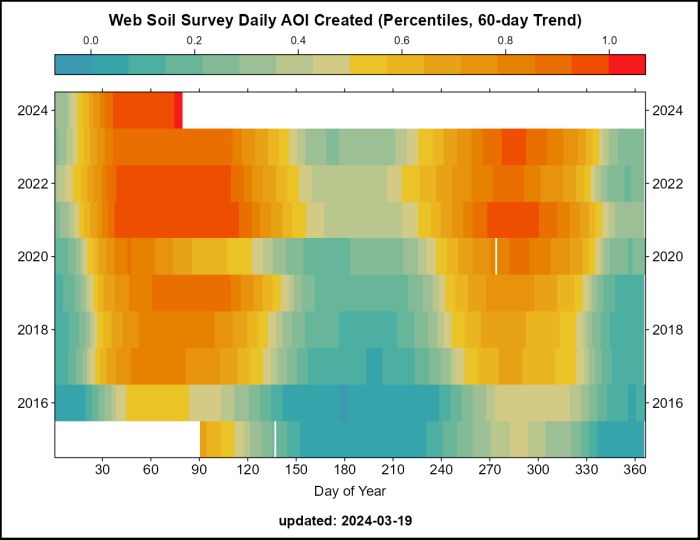
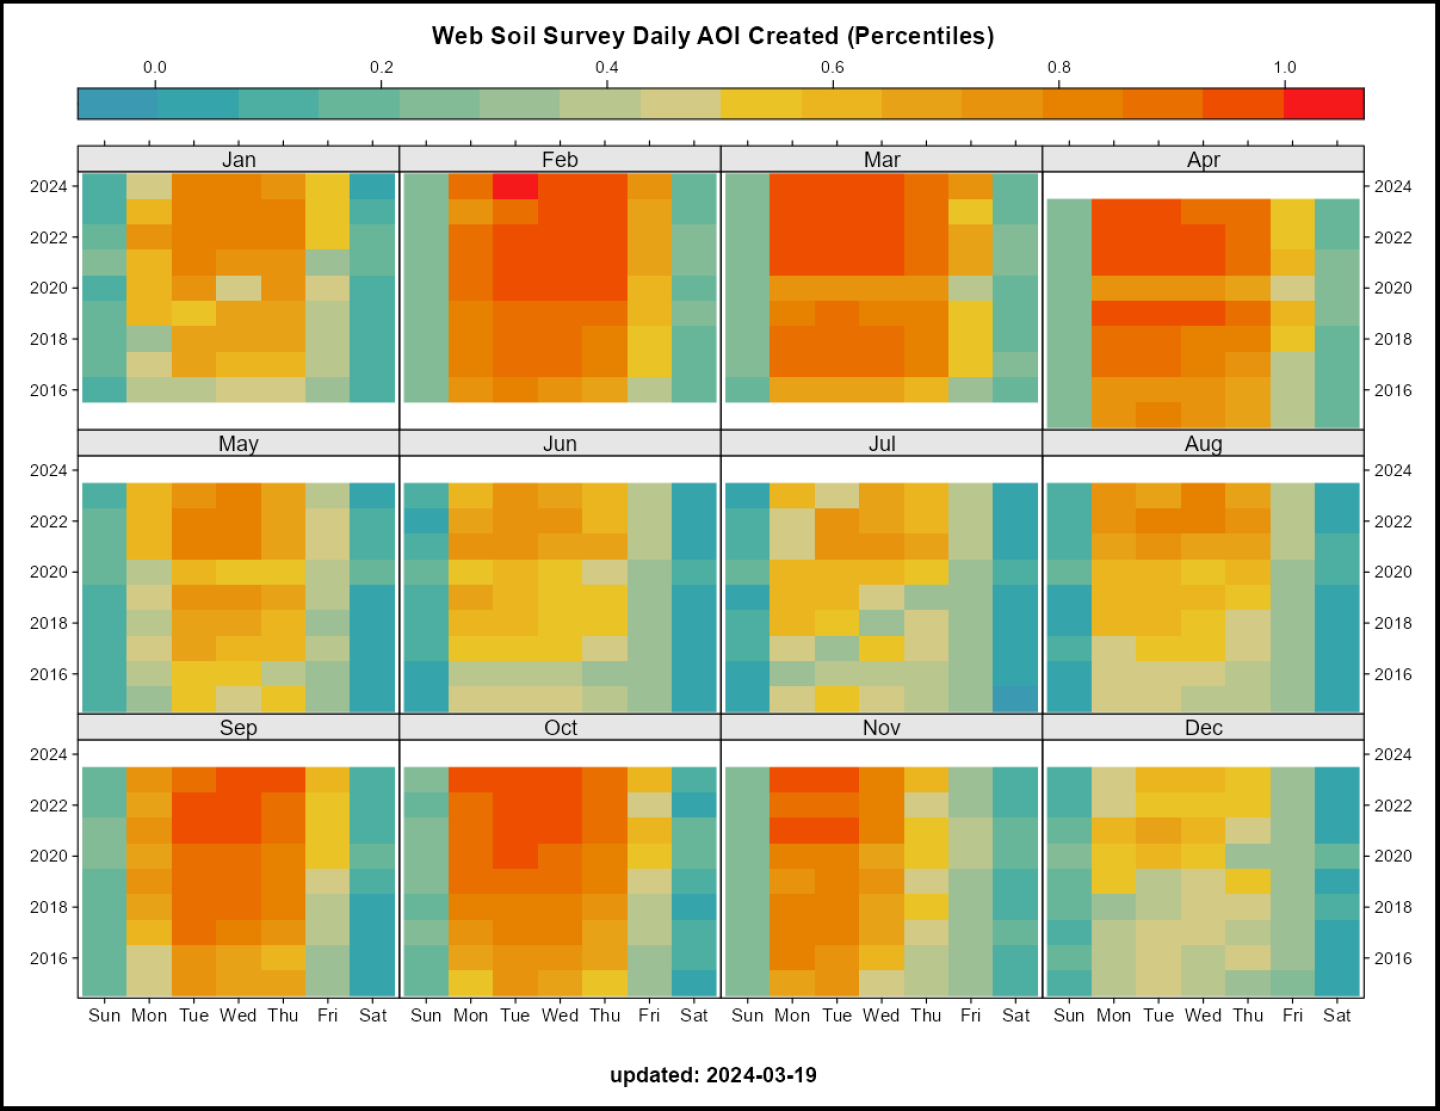
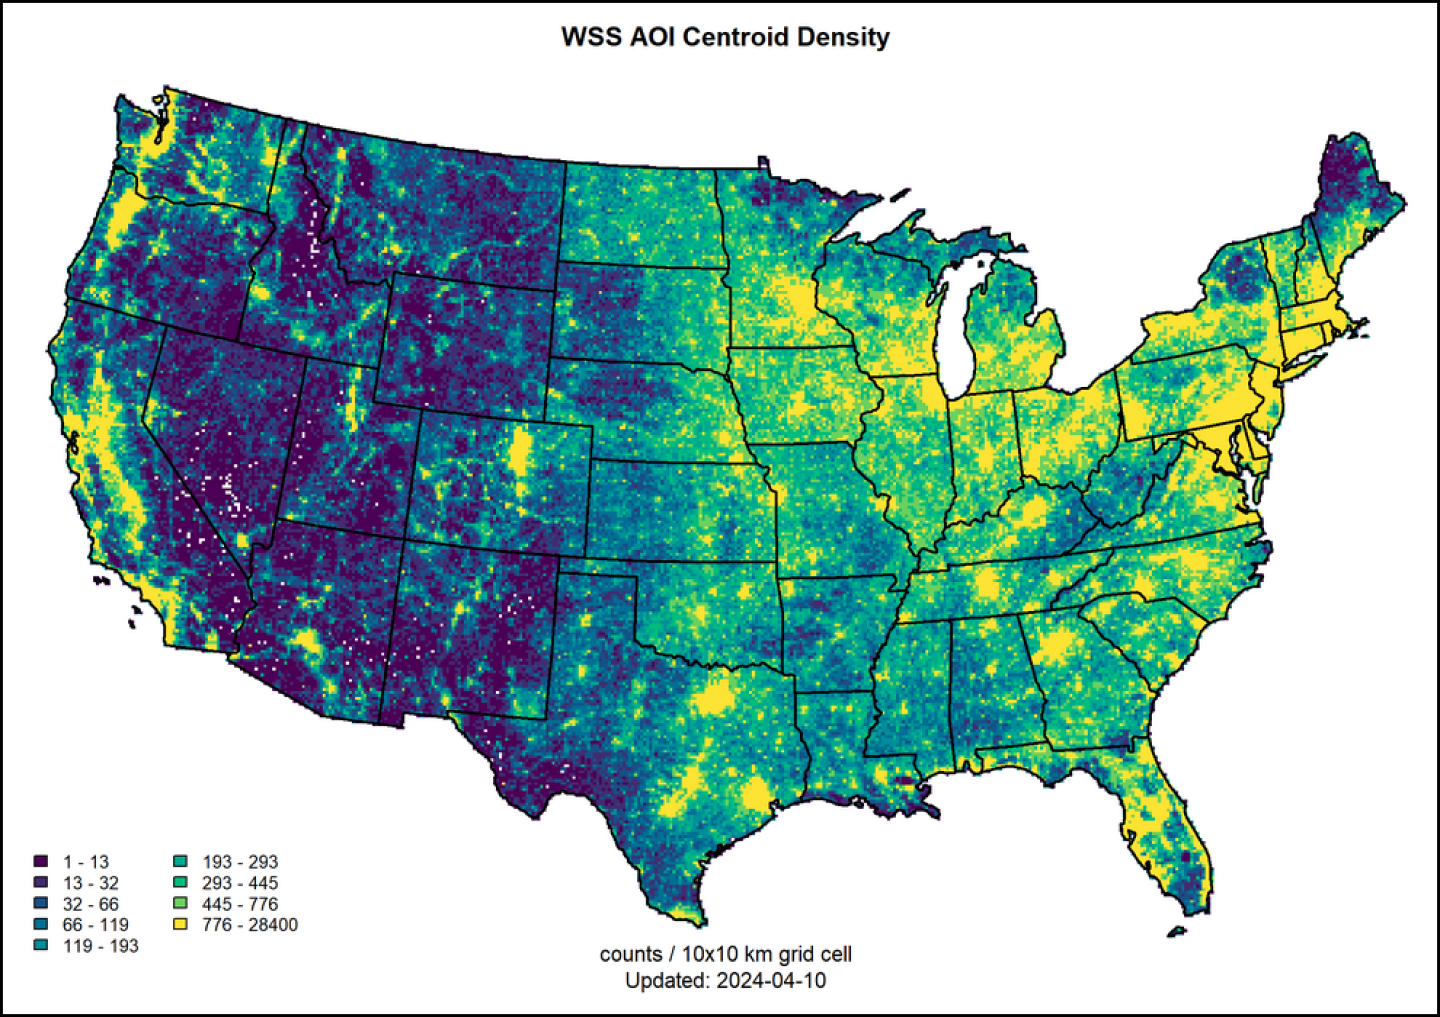
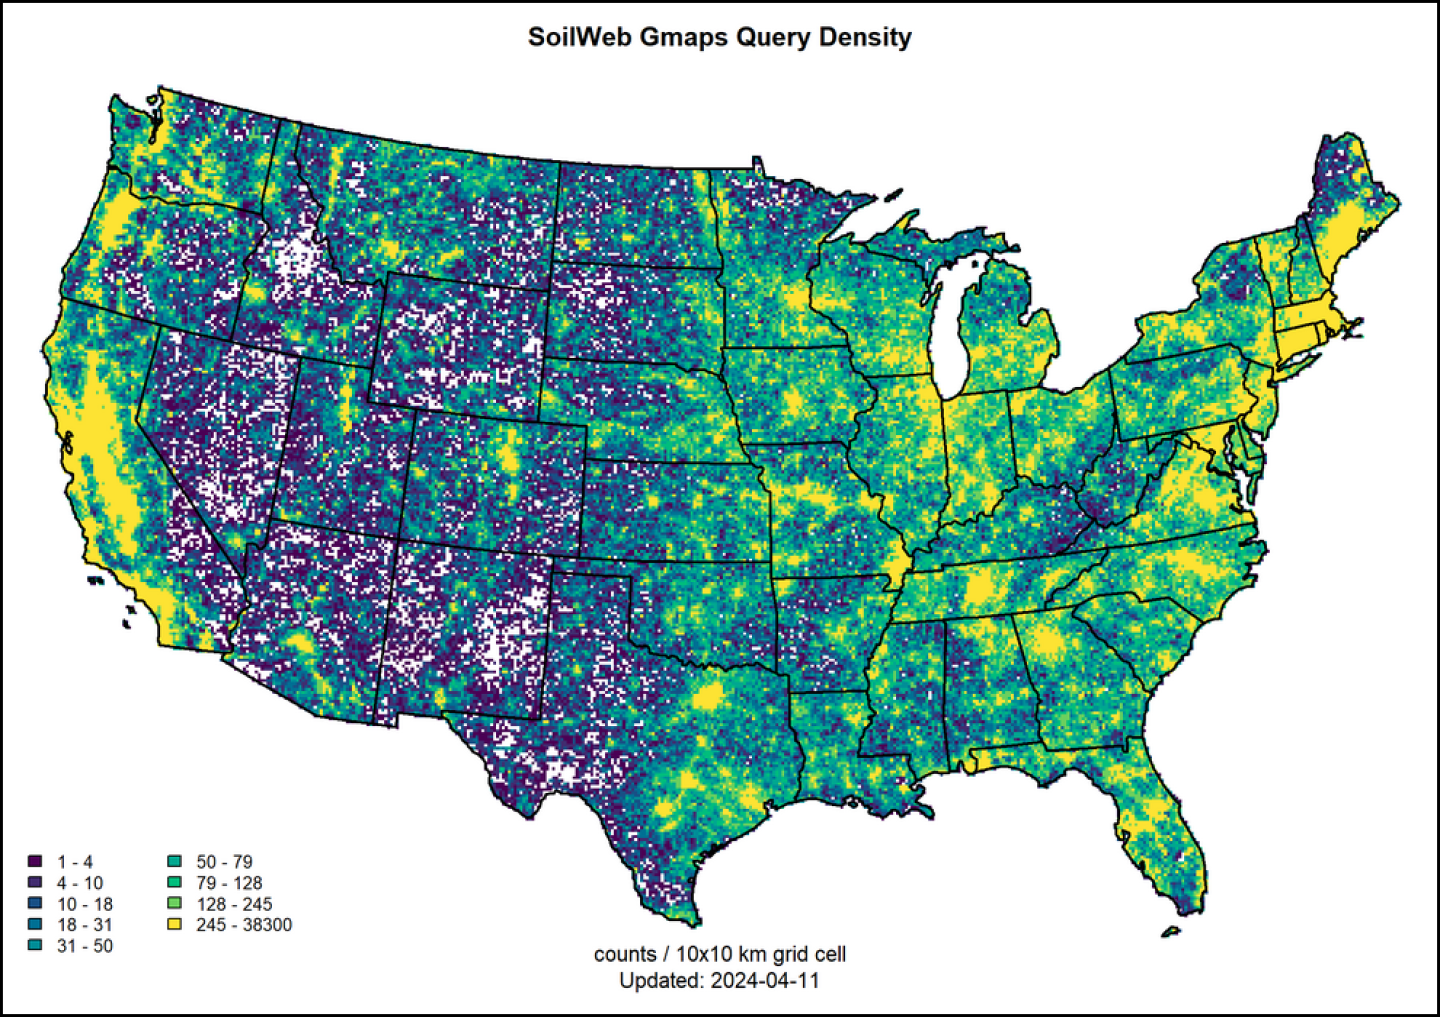
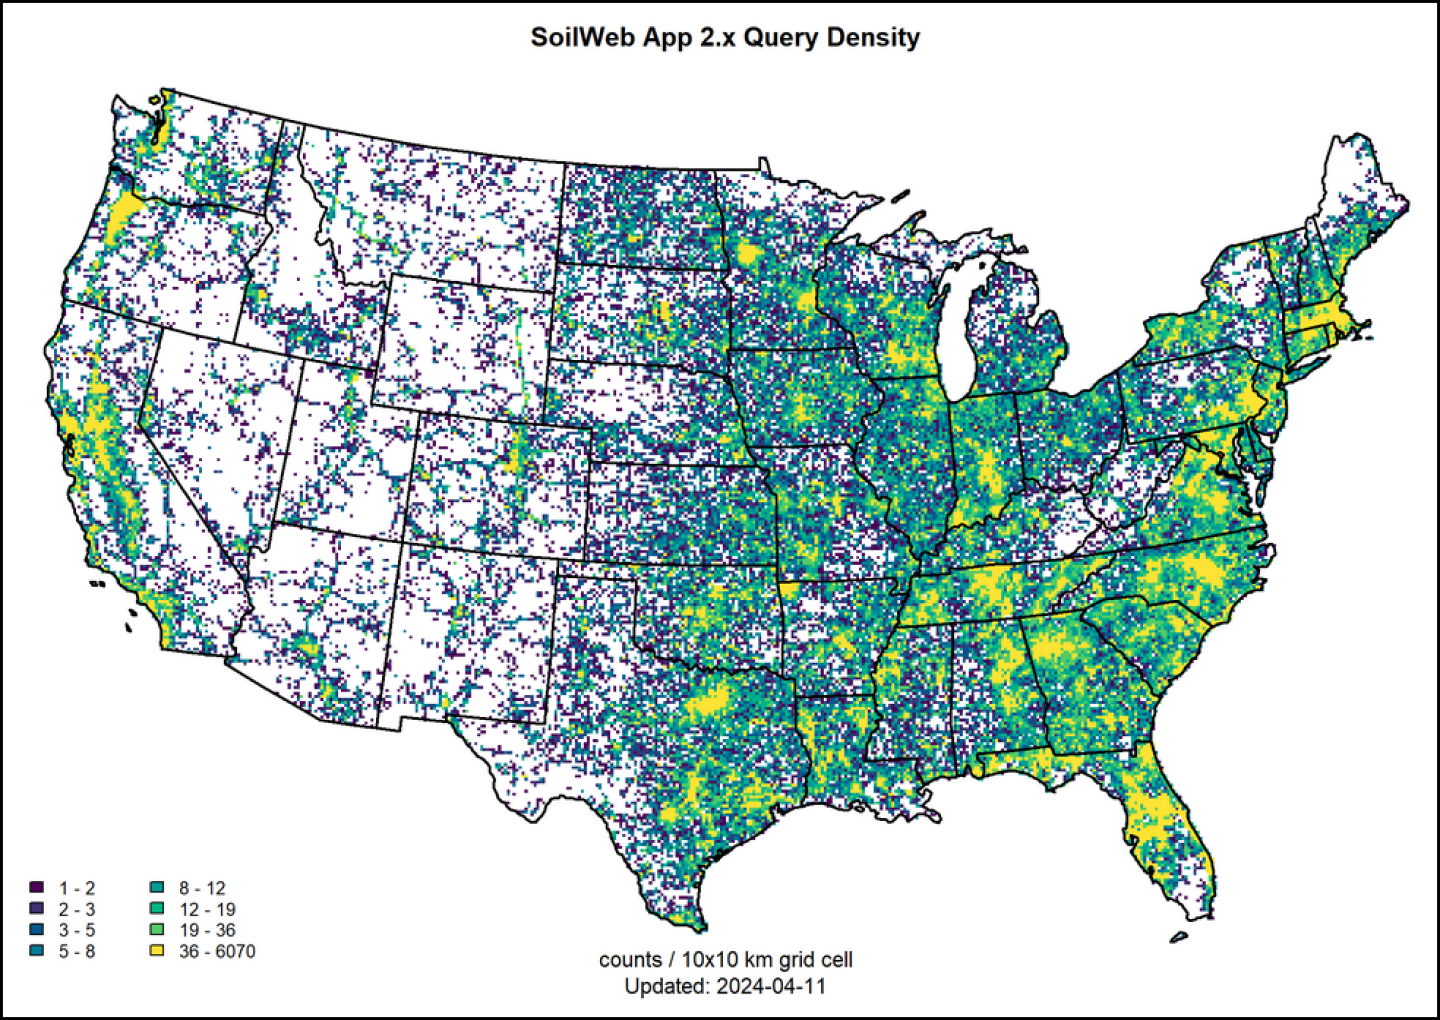
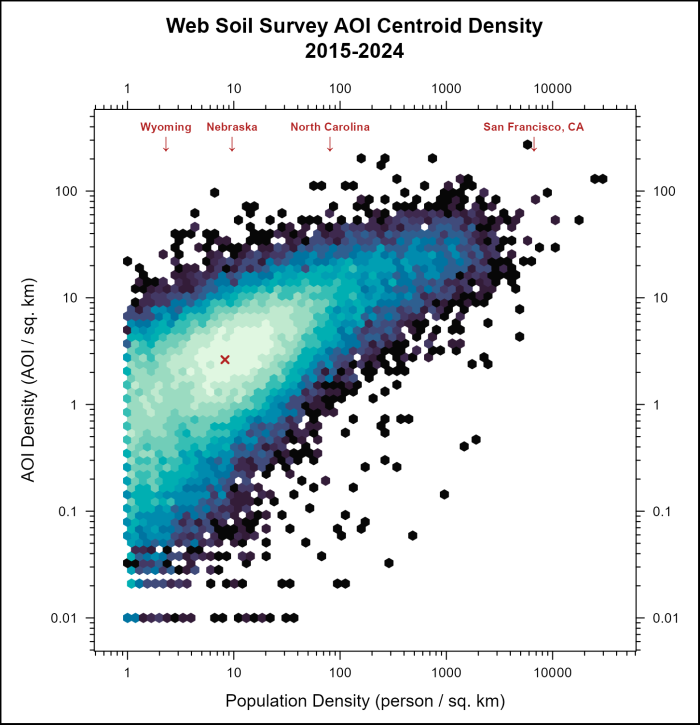
The following maps and figures highlight Web Soil Survey, Soil Data Access, and SoilWeb access patterns through a temporal and spatial lens. Web Soil Survey metrics are based on “areas of interest” (AOI) created by users of the website. Soil Data Access metrics are based on distinct queries submitted to the web-service. SoilWeb metrics are based on user “clicks,” either on a map interface or while using a mobile device.
Summary
Metrics document the value of the soil information to NRCS-SPSD customers who are making informed decisions, protecting the land, and enhancing agricultural productivity. The clear and consistent demand for soil data, across a wide variety of geographic settings, demonstrates that Web Soil Survey, Soil Data Access, and SoilWeb play an important role in sustainable land management and conservation efforts. “Understanding metrics is a major step-forward in meeting the growing demand for NRCS soils data,” said Dave Hoover, retired NRCS-SPSD National Soil Survey Director. “Our soil scientists in every state helped us upgrade all our software and databases, improve our spatial data, and put together a complete suite of soil interpretations and other products our customers want.”
What Do Our Different Tools Do?
Web Soil Survey (WSS): Providing access to the largest natural resource information system in the world, Web Soil Survey is a one-stop shop to a wealth of free, soil information along with soil maps, properties, and interpretations. WSS provides soil maps and data available online for more than 95 percent of the nation’s counties.
SoilWeb: SoilWeb was developed by the California Soil Resource Lab at the University of California Davis and University of California Agriculture and Natural Resources in collaboration with the USDA Natural Resources Conservation Service. It is an online soil survey browser. SoilWeb products can be used to access USDA National Cooperative Soil Survey detailed soil survey data managed through the Soil Survey Geographic Database, or SSURGO, for most of the United States.
Different SoilWeb Apps allow customers to explore and utilize different data. The apps include: SoilWeb that can be used to explore soil survey areas using an interactive Google map and to view detailed information about map units and their components. It is compatible with smartphones, tablets, and desktop computers. The Soil Series Extent Explorer application can be used to quickly display and compare the approximate geographic distribution of up to five soil series. The Soil Data Explorer provides detailed information about a given soil series.
Dynamic Soils Hub: SPSD’s award-winning Dynamic Soils Hub expands USDA’s capacity to model and report on soil properties that change with conservation management on a human timescale. The Hub was developed to rapidly respond to customer requests for science-based soil property data. At the state level, SPSD collaborates with state conservation staff using tools such as the highly erodible land tool and nutrient runoff tool. It supports the Conservation Innovation Grants, Conservation Stewardship Program, Environmental Quality Incentives Program, and nationwide soil health efforts.
Soil Data Access: Soil Data Access is a suite of web services that allows advanced users to submit custom queries and stream data into software. It serves all communities equally in the ability to generate interpretations for management and use, support conservation programs and planning, and respond to environmental changes.
Contact Soils
Please contact us if you see something that needs to be updated, if you have any questions, or if you need accessibility assistance.