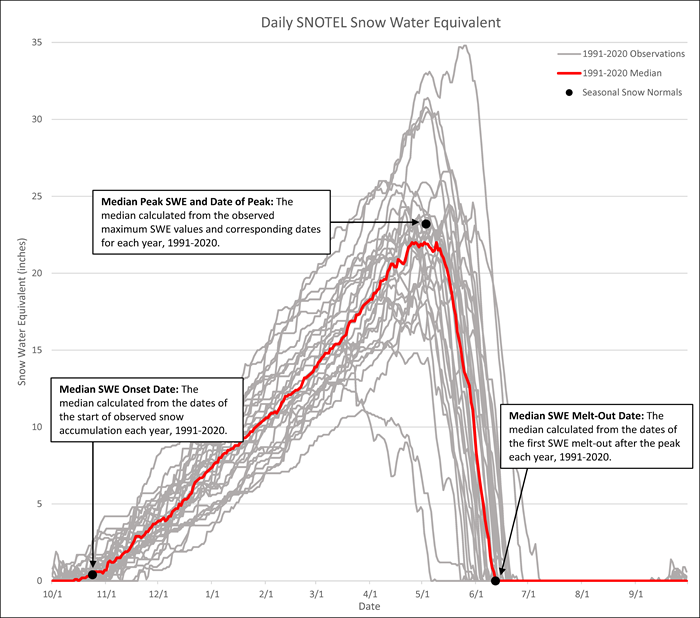
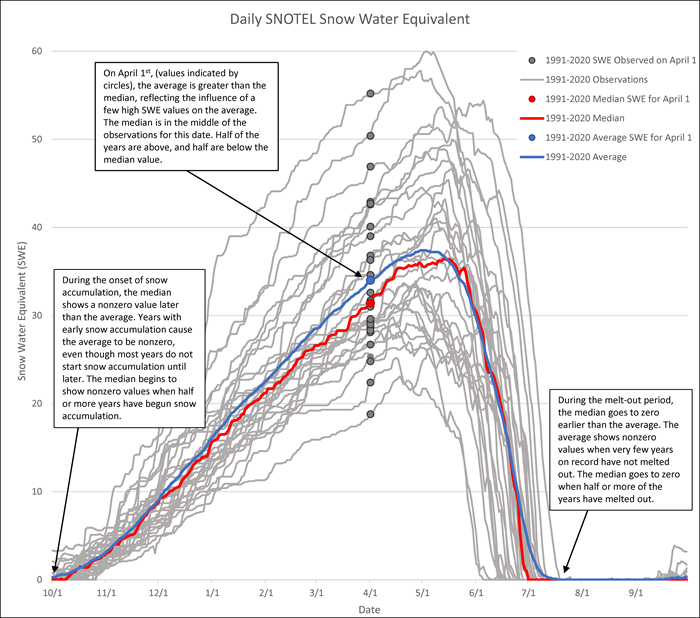
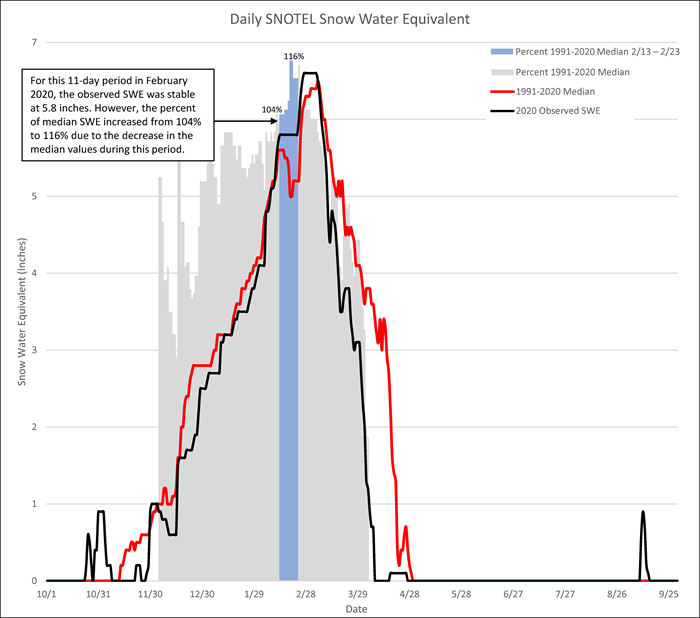
The 1991-2020 normals update may result in a change to the central tendencies at a particular site compared to the values for 1981-2010. A shift in the normals may occur because the underlying data used to compute the statistics are not the same between the two 30-year periods. Updated calculation methods for 1991-2020 may also contribute to the difference between current and previous normals. Therefore, caution is recommended when making inferences from comparisons between the 1991-2020, 1981-2010, and 1971-2000 normals. The following subsections provide details on the different calculation methods between NRCS normals for each reference period.
Data Estimation
1981-2010 normals for SNOTEL sites and snow courses with less than 20 years of data were created using estimation methods. For SNOTEL sites, a ratio adjustment was applied to the normal of a short record station using the normal from a longer record station. For snow courses, cross-correlation was used to estimate data for missing years. Calculations for 1991-2020 normals do not use any estimation techniques. Only observed data are used to compute the normals to maintain consistency across all data types.
Smoothing
A seven day smoothing algorithm was applied to the 1981-2010 daily SNOTEL SWE average and median. 1991-2020 normals are not smoothed for any data type or duration. The lack of smoothing may result in day-to-day fluctuations in the time series of daily normals, but the normal value for a given day will be the true average or median of the data observations for that day.
Serial Completeness
The 1981-2010 normals required serially complete data for daily normals. This rule resulted in an omission of an entire year from the normal calculations for a site if any data from that year were missing. The 1991-2020 normals do not require this serial completeness for a year to be included in the average and median calculations. As a result, the number of observations used in a series of normals may vary. For example, a SNOTEL site may have had a malfunctioning SWE sensor for a two-week period during February 1991. This site would have 30 years available for most daily SWE normals, but only 29 years available during the two-week period in February. This change in the number of observations can result in variability in the time series of the daily (or other duration) normals, but it allows for the inclusion of potentially significant data that would otherwise be omitted.
Peak SWE Calculations
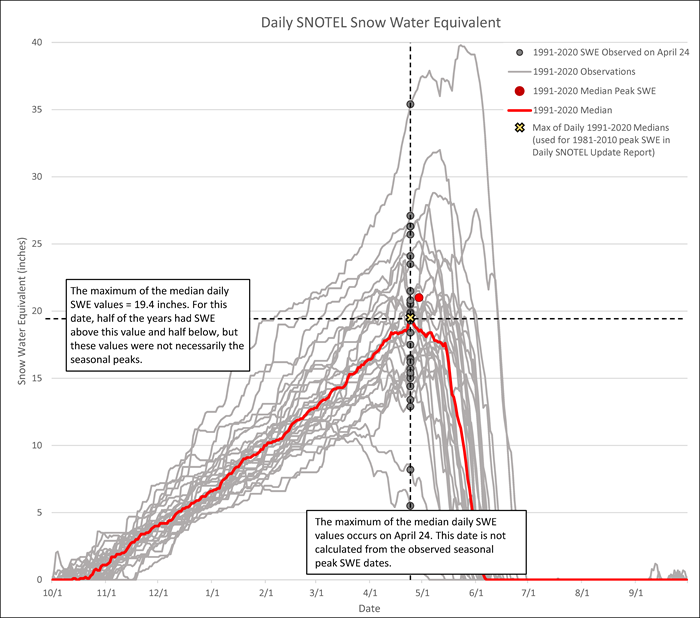
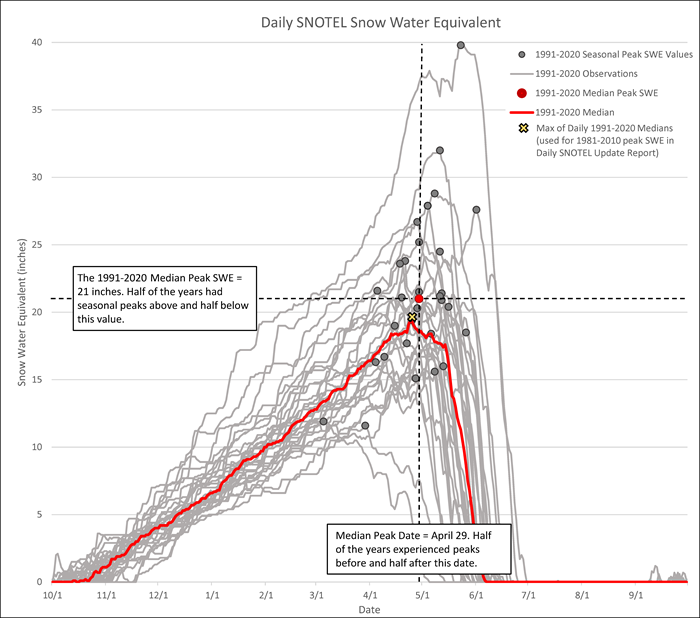
The method for calculating peak SWE normals is different for 1991-2020 in some applications, such as the daily SNOTEL Snowpack Update Report. For 1981-2010 normals, the peak SWE was derived in these reports as the maximum value from the set of daily SWE medians. The peak SWE date was the date corresponding to this maximum. For the 1991-2020 normals, the seasonal peak SWE and corresponding date are determined each year available during the reference period. The average and median are then calculated for this subset of the seasonal peaks. The method for 1991-2020 provides a more accurate depiction of the normal seasonal peak SWE.
Old Method for Calculating 1981-2010 Median Peak SWE
New Method for Calculating 1991-2020 Median Peak SWE
Central Tendencies
The statistic used as the official NRCS normal for the 1981-2010 period varied by data type. The median was used as the official 1981-2010 normal for SWE and some streamflow locations, while the average was used for precipitation, most streamflow locations, and reservoir storage. The 1971-2000 normals only include the average. The median is the official 1991-2020 NRCS normal for all data types and will be the default for most NWCC applications.
1971-2000 Averages
Most SNOTEL sites did not exist in 1971. The first major installations of SNOTEL sites occurred in the late 1970s to early 1980s. Therefore, data at some SNOTEL sites for the 1970s were estimated in the 1971-2000 normals using different methods than for 1981-2010.
Interpreting Changes in Normal Values
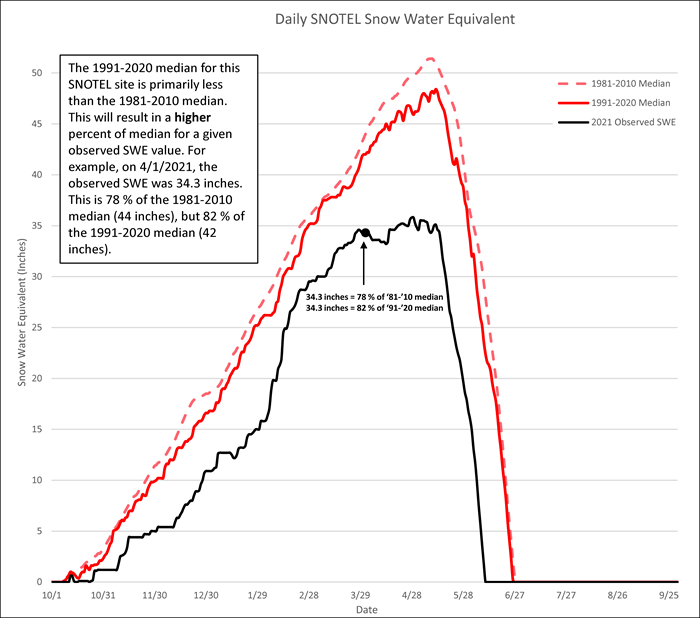
A change in the normal values going from 1981-2010 to the new 1991-2020 reference period will result in a subsequent shift in the percent of normal (officially the percent of median) often used for assessing water supply conditions at a site. The 1991-2020 normal values that are less than the 1981-2010 normals will result in higher percent of normal values for the same observation, and vice versa.
1981-2010 Median SWE Compared to 1991-2020 Median SWE
Comparing 1981-2010 and 1991-2020 Normals
The Interactive Map provides access to charts comparing the official normals used for 1981-2010 with the official 1991-2020 normals. At each of the links below, click on a station or basin of interest, and in the resulting popup follow the link labeled ‘1991-2020 vs 1981-2010 Normals’. Comparisons for SWE and some streamflow locations will show 1981-2010 median and 1991-2020 median. All other comparison charts show the 1981-2010 average and 1991-2020 median. As noted above, caution is recommended when making inferences from comparisons between the two reference periods.
SNOTEL SWE and Accumulated Precipitation
Snow Course SWE and Snow Depth
Streamflow Volume
Reservoir Storage
Basin-wide SNOTEL SWE
Basin-wide SNOTEL Precipitation

