| A |
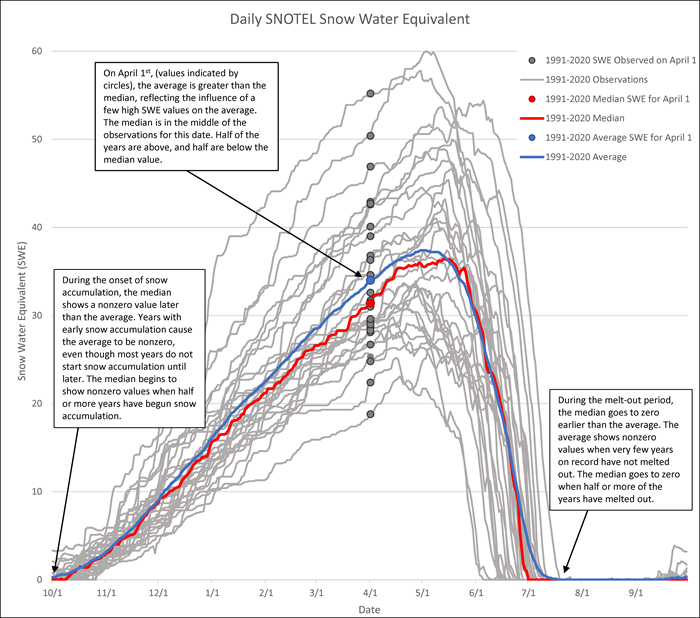
The median is the middle point for a range of observations, and it may differ from the average for the same dataset. Because the median is the center of a dataset, it may provide a better indicator than the average of the true central tendency for a range of observations. The median is less affected than the average by outliers, or large hydroclimatic events that can skew the distribution of the observations. Many stations collecting hydroclimatic data are prone to these extreme events, where a few high years can impart a large influence on the 30-year average. In these cases, the median is often smaller than the average and will still remain the center of the dataset, or the point at which half of the years have been greater, and half have been less during the reference period. The median also remains a valid measure of central tendency for datasets that have not experienced these extreme events. Using the median universally as the official normal will provide consistency across data types and stations, and should help reduce confusion when determining the appropriate reference statistic.
1991-2020 Median SWE compared to the 1991-2020 Average
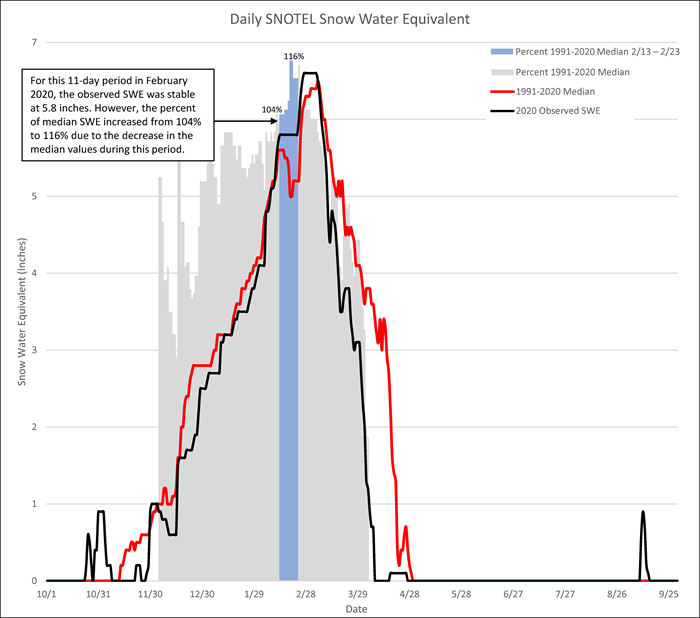
The daily average time series tends to follow a more uniform pattern than the daily medians. The lack of smoothing and presence of serial incomplete data can amplify fluctuations in the median from day-to-day, particularly for daily SWE medians. For example, intermittent decreases in the median SWE time series prior to the peak are often an accurate characterization of the seasonal accumulation patterns at the particular site. However, this can make interpretation of the percent of median from day-to-day less intuitive because the percentages may have considerable fluctuations when the observed SWE is unchanging. This behavior may be more pronounced at some sites, particularly those with intermittent snow characteristics or sites that typically experience temporary melt periods prior to the seasonal peak.
Variations in Percent of Median for Stable Daily SWE
|

