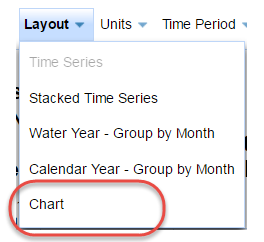
Select Layout
This tutorial shows how to choose the layout (format) of the report in Report Generator. Available layout options are:
- Time Series. Single station or multi-station report. The report will display for all stations defined with elements listed on a per-station basis. That is, each report will include all elements for that station for the time period defined. For example:
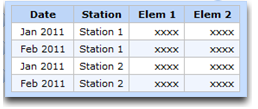
- Stacked Time Series. Multi-station report. The report will display all stations with elements listed on a per-station basis. For example:
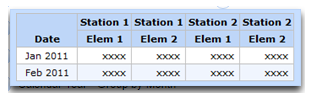
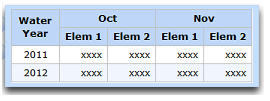
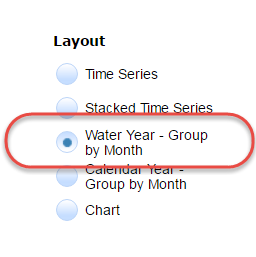
- Water Year - Group by Month. Single station or multi-station report. The report will display for all elements defined, grouped by month for the current water year (Oct. 1-Sept. 30). For example:
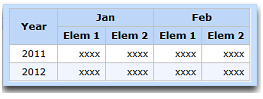
- Calendar Year - Group by Month. Single station or multi-station report. The report will display for all elements defined, grouped by month for the current calendar year (Jan. 1-Dec. 31). For example:
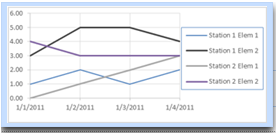
- Chart. Single station or multi-station chart. Report Generator will display a line chart for all elements and all the stations defined. For example:
The following tutorial uses a Standard data report (Snow Depth) to change the layout for data displayed in the View Report tab from Standard to Chart.
The tutorial consists of two, quick lessons:
- Lesson 1: Change layout from Standard to Group Elements by Month
- Lesson 2: Change layout from Standard to Chart
Lesson 1: Change Layout from Standard to Group Elements by Month
- Start Report Generator.
- Select the Create/Modify Report tab.
- Choose the station. In the Enter station(s) field, enter the following station ID: 526.
- Station 526, Hogg Pass, will be added to the Selected Stations list. When a station is added, the View Station Information link appears in the upper left corner of the application.
- Select the View Station Information link. The Station View panel will open, displaying the station name, station metadata (such as Network, County, Elevation, Latitude, and Longitude), a site photo and a link to the site in Google Maps.
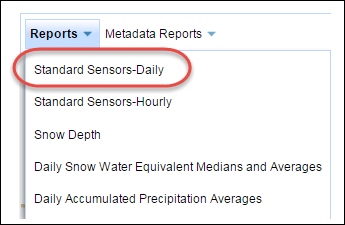
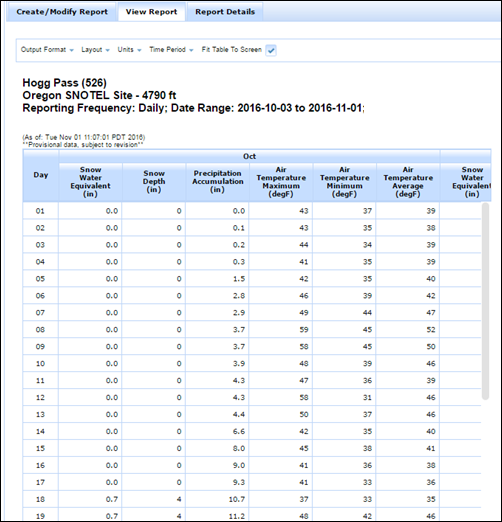
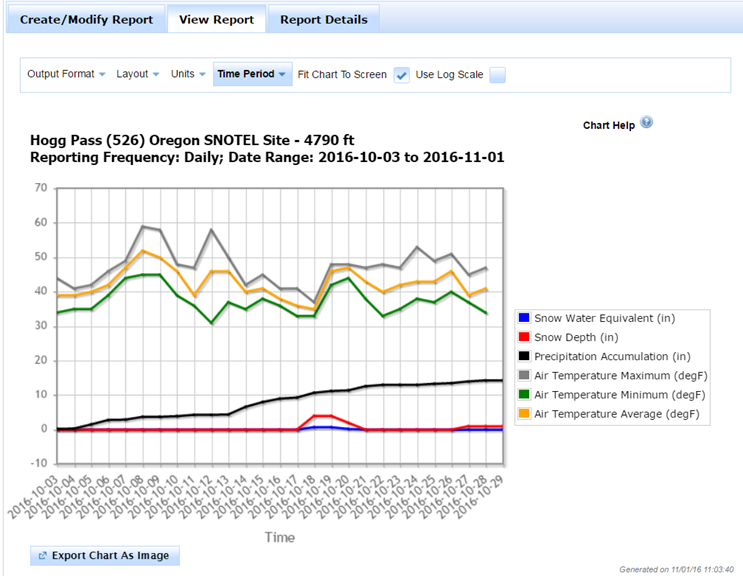
- From the Station View pane, hover over the Reports dropdown list and select Standard Sensors-Daily. A tabular report will open, displaying the snow water equivalent, snow depth, precipitation accumulation, and air temperature minimum, maximum and average for the Hogg Pass site for the last 30 days.
- In the View Report tab, select Water Year - Group by Month in the Layout drop-down list. The report will change from elements being listed on a per-station basis to elements being listed on a per-month basis.
Continue to Lesson 2: Change Layout from Standard to Chart.
Lesson 2: Change Layout from Standard to Chart
- In the View Report tab, select Chart from the Layout drop-down list. The report will change from a tabular format to a line chart.
Tip: To save the results of this report:
- From the Output Format drop-down list, select the csv format icon (
 ) to save the file to a comma-separated value (.csv) format or to an Excel (.xls) spreadsheet.
- To save the chart to a graphics format such as .jpg or .png, select the Export Chart as Image button, then right-click on the image to save it.

