| Q |
Does Report Generator have any predefined report formats I can use? |
| A |
Report Generator has several predefined reports available. When you add a station to Report Generator, the View Station Information link to open the Station View pane.
In the Station View pane, the Reports and Metadata Reports ( ) dropdown menus contain several predefined report templates. For example, choose from both hourly and daily standard sensor reports, snow depth, daily snow water equivalent medians and averages, and sensor metadata reports. ) dropdown menus contain several predefined report templates. For example, choose from both hourly and daily standard sensor reports, snow depth, daily snow water equivalent medians and averages, and sensor metadata reports. |
| |
|
| Q |
What are the sources of data Report Generator uses? |
| A |
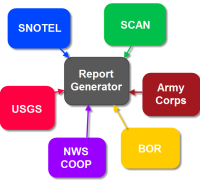 |
Report Generator uses data from the National Resources Conservation Service (NRCS) Water and Climate Information System (WCIS) databases. This includes manually-collected snow course data and information from automated Snow Telemetry (SNOTEL) and Soil Climate Analysis Network (SCAN) stations.
Report Generator also uses precipitation, streamflow, and reservoir data from the U.S. Army Corps of Engineers (USACE), the U.S. Bureau of Reclamation (BOR), the National Weather Service (NWS), the Applied Climate Information System (ACIS), the U.S. Geological Survey (USGS) and various water districts and other entities.
|
| |
|
| Q |
I created a tabular report in Report Generator. Is it possible to export this data for further analysis? |
| A |
Yes. In the View Report tab, select the CSV icon ( ) from the Output Format dropdown list ( ) from the Output Format dropdown list ( ). A web page will open with the data from the report displayed. Open a text editor (such as Notepad or Excel). Copy and paste lines that do not begin with a pound sign (#) into the text editor. Save the file with a .csv extension. ). A web page will open with the data from the report displayed. Open a text editor (such as Notepad or Excel). Copy and paste lines that do not begin with a pound sign (#) into the text editor. Save the file with a .csv extension. |
| |
|
| Q |
I created a chart in Report Generator. Can I save this chart to another format? |
| A |
Charts may be saved to a graphics format or exported to another format (such as .csv. or .xls).
To save the chart in a graphics format, select the Export Chart as Image button ( ). When the file opens, right-click the chart and select Save image as... Save the file to a graphics format, such as .png or .jpg. ). When the file opens, right-click the chart and select Save image as... Save the file to a graphics format, such as .png or .jpg.
To export the data to .csv or .xls format, in the View Report tab, select the CSV icon () from the Output Format dropdown list (). A web page will open with the data from the report displayed. Open a text editor (such as Notepad or Excel). Copy and paste the data from the web page into the text editor. Save the file with a .csv extension.
|
| |
|
| Q |
I'm using Internet Explorer as my browser. Many of the functions of Report Generator aren't working correctly. |
| A |
Report Generator 2.0 won't function properly in Internet Explorer if Compatibility View is enabled, or if the USDA.gov domain has been added to Compatibility View. To disable Compatibility View, go to Tools > Compatibility View Settings in Internet Explorer, and disable (uncheck) the Display Intranet Sites in Compatibility View checkbox. If USDA.gov is in the Websites you've added to Compatibility View list, highlight USDA.gov and select the Remove button. |
| |
|
| Q |
I want to create a report for all the sites within a basin, but I don't know the site names or station IDs. Can Report Generator find those sites? |
| A |
If you know all or part of the Hydrologic Unit Code (HUC) for the basin, you can use the Advanced Search feature in Report Generator to quickly define a list of sites within the basin. Simply select the data Network, then enter the HUC for the basin (1-12 digits, wildcards are accepted), and select Search. |
| |
|
| Q |
Can Report Generator be used to create multi-station charts? |
| A |
Yes. Version 2.0 of Report Generator supports multi-station charting. |

