Change Column Order
This tutorial shows how to change the order that columns appear in a report in Report Generator. It also shows how to change the sort order of a column in a report. The example moves the metadata element HUC2 (2-digit HUC) to the top of the order. The final report will therefore display the HUC as the first item in the report, followed by air temperature minimum and air temperature maximum.
Note: If you're continuing this tutorial from the Add a Metadata Column tutorial, go to Lesson 2: Change order of data types.
Lesson 1: Add data types
- Start Report Generator.
- Select the Create/Modify Report tab
- Add a station. In the Select Stations Enter station(s) field, enter 526. The Hogg Pass station is added to the Selected Stations list.
- Add an element. In the Select Columns pane, select the Data tab.
- Under Element, select "air temperature minimum."
- Under Depth, select "None."
- For Value Type, select 'Value."
- For Function, select "None."
- Select the Add button to add the element to the Manage Selected Columns list.
- Add a second element for the previous year. Under Element, ensure "air temperature maximum" is selected.
- Under Depth, keep "None"
- For Value Type, select "Previous Year's Value."
- For Function, select "None."
- Select the Add button to add the element to the Manage Selected Columns list.
- Add another element. Under Element, select "snow water equivalent."
- Select the Add button.
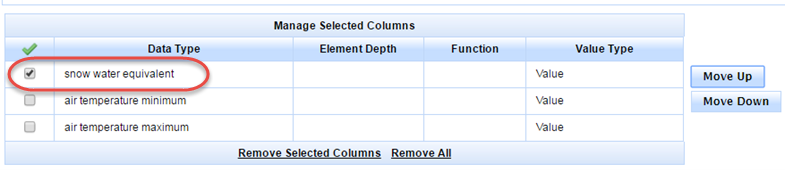
The display should look similar to the following.

Lesson 2: Change order of data types
- Enable the checkbox next to the snow water equivalent Data Type.

- Select the Move Up button. The snow water equivalent Data Type will move up one level in order.
- Select the Move Up button again. The snow water equivalent Data Type will move to the top of the list, and will therefore appear as the first column on the final report.
Lesson 3: Change sort order of columns in report
- In the Select Time Period, Layout, and Units pane, select the following:
- Interval/Duration = Daily
- Report Instantaneous Data As = Start of Period
- Time Period = Last 7 Days, All Months, All Days
- Layout = Time Series
- Units = English
- Output Format = HTML
- Select the View Report button. A report similar to the following will open

Note that each column in the report has Up/Down arrows next to the column heading. The Up/Down arrows allow you to sort the columns as follows:

Take some time to explore how each sort option works for each column in the report.
This completes the Change Column Order tutorial.

