
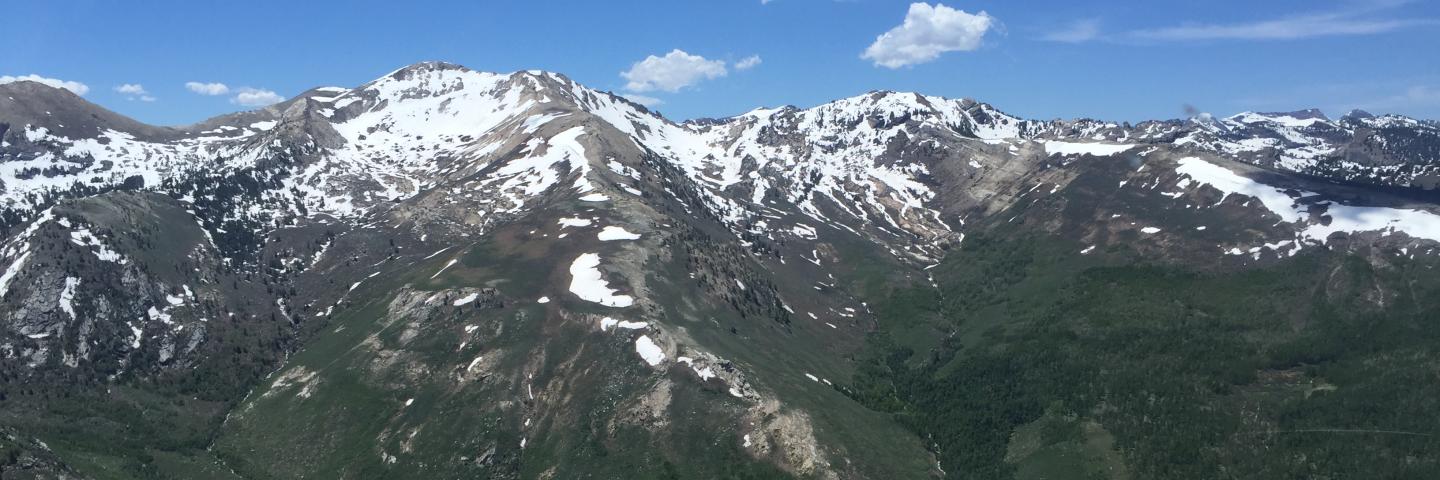
Nevada’s NRCS Snow Survey Program provides mountain snowpack data and streamflow forecasts across the state and the Eastern Sierra. This information is valuable for conservation planning, water supply management, flood control, drought and avalanche prediction, climate modeling, and recreation.
Latest Report and Forecasts
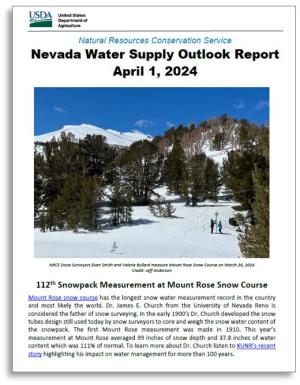
April 1, 2024 Water Supply Outlook Report
April 1, 2024 Streamflow Forecasts
If you are a new subscriber:
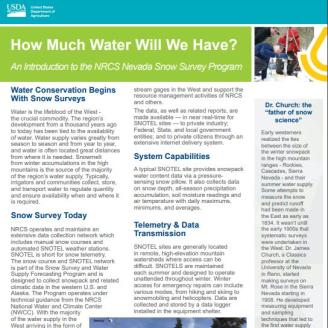
Reading the background information (on page two of the report) and the appendix information will assist in interpreting the data and forecasts. The overview video (below) provides an introduction to the snow program.
Learn more...
Current Conditions
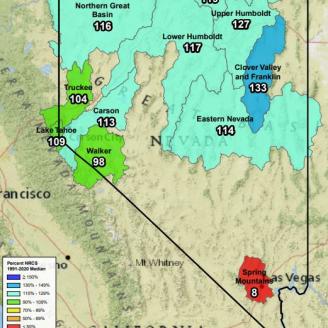
Today's Map: Snowpack | Water Year Precipitation | Monthly Precipitation
Update Report: Snow and Precip Percent of Median
Update Report: Snowpack Percent of Median Peak
Update Report: Month-to-Date Precip as Percent of Monthly Median
Data, Products, Streamflow Forecasts
Snow Survey Data and Reports
Subscribe to the Water Supply Outlook Report
Reports are published January through May and summarize snowpack, precipitation and water supply conditions throughout the state.
Snow Survey Data and Products
Links to SNOTEL and snow course data and water supply conditions. Resources include tables, charts, maps, and reports. Data includes snowpack, precipitation, temperature, soil moisture, streamflow forecasts, and reservoir storage.